
Ever wonder what the formula is for a happy trip? For the second year in a row, we did a deep dive on our users’ flight ratings to see what makes them happiest. For this year’s analysis, TripIt looked at nearly one million flight ratings to determine what factors impacted traveler happiness in 2018.
We found that where travelers live, which airports they visit, their generation, and the time of year they traveled all had an impact on how happy they were with their flights.
Here’s a closer look:
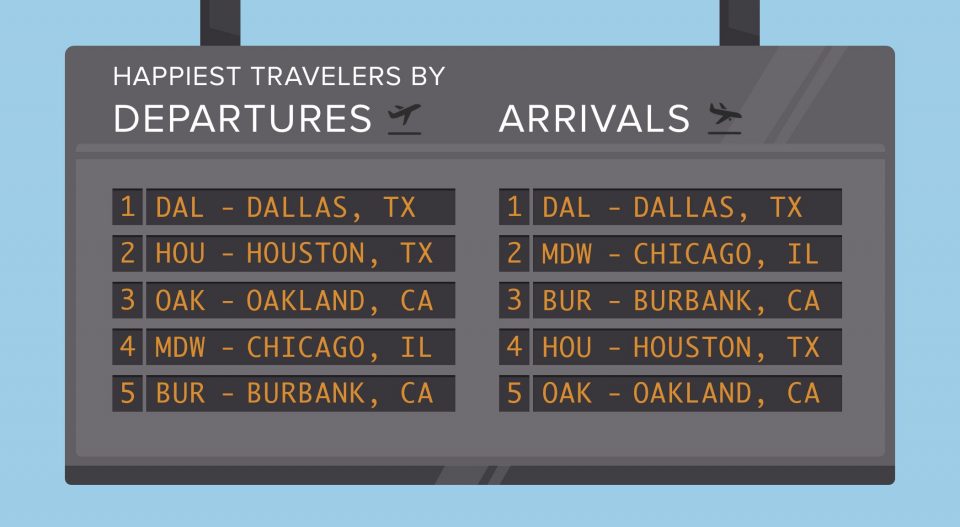 The majority of travelers that either departed from or arrived at airports that were not the main hub in that city tended to rate their flights higher.
Travel expert Lee Abbamonte shared, “In my experience, smaller airports can be easier to navigate, less crowded, and be more efficient from parking and security to customs and baggage claim.”
The majority of travelers that either departed from or arrived at airports that were not the main hub in that city tended to rate their flights higher.
Travel expert Lee Abbamonte shared, “In my experience, smaller airports can be easier to navigate, less crowded, and be more efficient from parking and security to customs and baggage claim.”
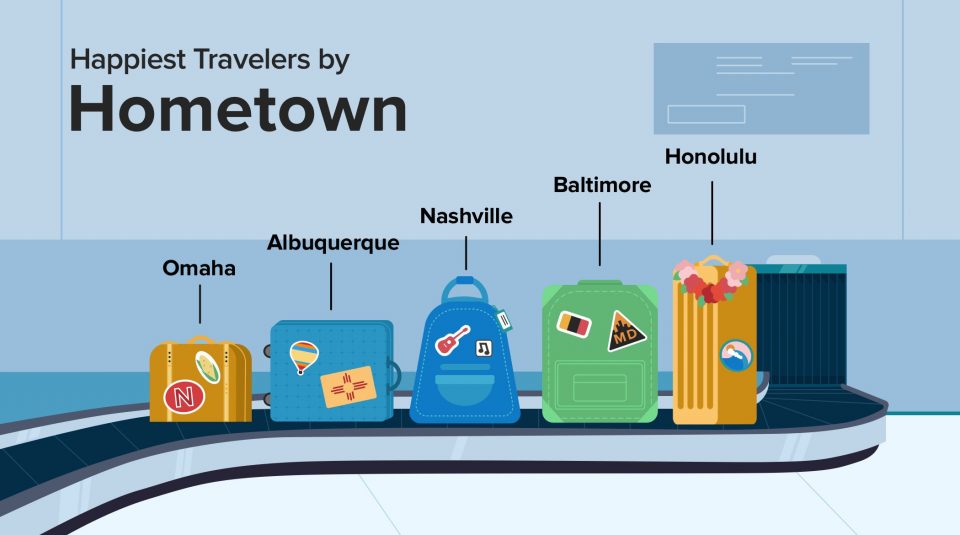 Travelers living in Honolulu, HI topped the charts again this year as the happiest fliers in the nation. The happiest hometowns of 2018 remained largely the same as last year, with those cities below the Mason–Dixon line like Tampa, New Orleans, Fort Lauderdale, and Atlanta holding strong and capturing several of the top 25 slots.
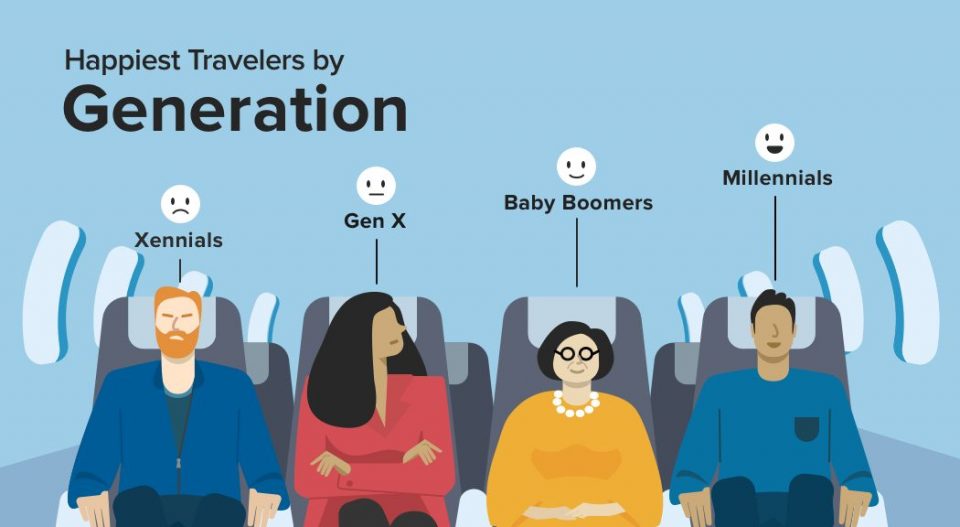
Looking at the average flight rating across generations, we found that Millennials (1983-1999) were the happiest flyers, followed by Baby Boomers (1946-1964). Generation X ranked as the third happiest, with Xennials (the microgeneration between Generation X and Millennials), ranked as the least happiest travelers.
Amy Jackson from the TripIt team shared, "As Xennials, we've now been in the workforce for nearly two decades and many of us have traveled hundreds of thousands of miles during that time. We've developed preferences for how we like to travel and have less tolerance for disruption—especially those of us who are also raising young children."
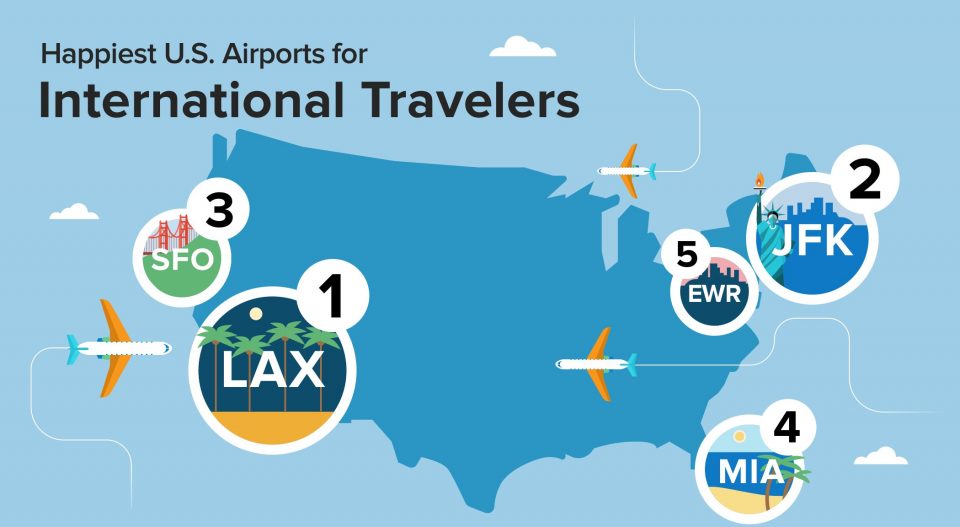 International travelers favored airports in coastal cities, with Los Angeles, San Francisco and New York topping the list.
All of the top ranked airports for international travelers offer Automated Passport Control (APC), which is a U.S. Customs and Border Protection (CBP) program that expedites the entry process for U.S., Canadian and eligible Visa Waiver Program international travelers. Instead of filling out a paper Customs declaration form, eligible passengers proceed directly to the APC kiosks in the passport control area. Travelers are prompted to scan their passport, take a photograph using the kiosk, and answer a series of CBP inspection related questions verifying biographic and flight information.
International travelers favored airports in coastal cities, with Los Angeles, San Francisco and New York topping the list.
All of the top ranked airports for international travelers offer Automated Passport Control (APC), which is a U.S. Customs and Border Protection (CBP) program that expedites the entry process for U.S., Canadian and eligible Visa Waiver Program international travelers. Instead of filling out a paper Customs declaration form, eligible passengers proceed directly to the APC kiosks in the passport control area. Travelers are prompted to scan their passport, take a photograph using the kiosk, and answer a series of CBP inspection related questions verifying biographic and flight information.
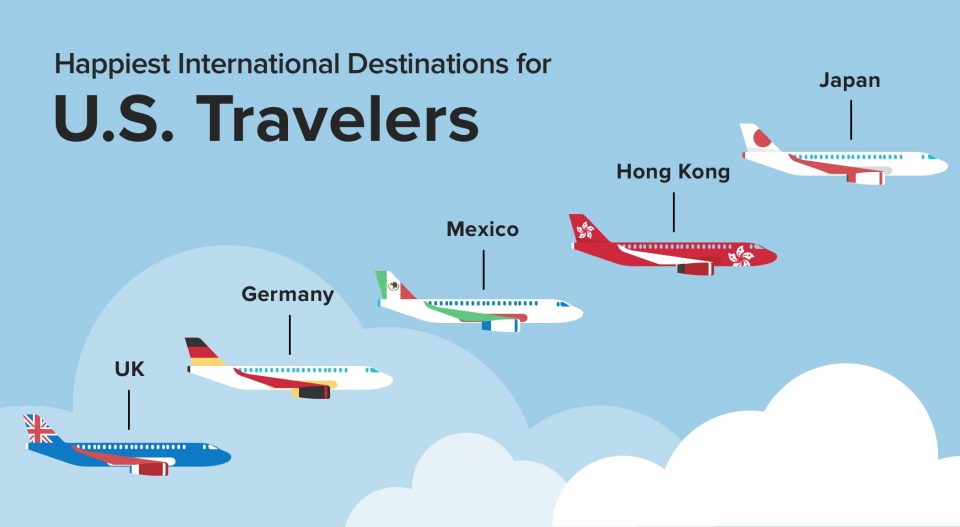 For US travelers, we found that Japan, Hong Kong and Mexico were popular destinations throughout the year. According to an article by the Economist, tourism in Asia and the Pacific is growing faster than anywhere else in the world.
Methodology: To determine the happiest travelers, TripIt looked at how travelers rated their flights. TripIt analyzed more than 969,000 flight ratings submitted over the course of one year, from 2017 to 2018. While international airports were omitted from the departure and arrival rankings, the traveler's home country was not required to be the US. Hometowns and airports with less than 1,000 ratings were omitted from the analysis. Regions were defined by those recognized by the U.S. Census. TripIt defined generations as follows: Millennials (1983-1999); Xennials (1977-1983); Generation X (1965-1976); and Baby Boomers (1946-1964).
Travelers Prefer Alternate Airports
The majority of travelers that either departed from or arrived at airports that were not the main hub in that city tended to rate their flights higher.
Travel expert Lee Abbamonte shared, “In my experience, smaller airports can be easier to navigate, less crowded, and be more efficient from parking and security to customs and baggage claim.”
| Departure Airport | Arrival Airport | |||||
| Rank | Airport | City | Rank | Airport | City | |
| 1 | DAL | Dallas, TX | 1 | DAL | Dallas, TX | |
| 2 | HOU | Houston, TX | 2 | MDW | Chicago, IL | |
| 3 | OAK | Oakland, CA | 3 | BUR | Burbank, CA | |
| 4 | MDW | Chicago, IL | 4 | HOU | Houston, TX | |
| 5 | BUR | Burbank, CA | 5 | OAK | Oakland, CA | |
| 6 | ONT | Ontario, CA | 6 | BNA | Nashville, TN | |
| 7 | STL | St. Louis, MO | 7 | BWI | Baltimore, MD | |
| 8 | SMF | Sacramento, CA | 8 | SJC | San Jose, CA | |
| 9 | PDX | Portland, OR | 9 | OGG | Kahului, HI | |
| 10 | BWI | Baltimore, MD | 10 | STL | St. Louis, MO | |
| 11 | SJC | San Jose, CA | 11 | SAN | San Diego, CA | |
| 12 | MCI | Kansas City, MO | 12 | PDX | Portland, OR | |
| 13 | BNA | Nashville, TN | 13 | SNA | Santa Ana, CA | |
| 14 | SAN | San Diego, CA | 14 | MCI | Kansas City, MO | |
| 15 | SNA | Santa Ana, CA | 15 | RSW | Fort Myers, FL | |
| 16 | TPA | Tampa, FL | 16 | ATL | Atlanta, GA | |
| 17 | MKE | Milwaukee, WI | 17 | SEA | Seattle, WA | |
| 18 | CMH | Columbus, OH | 18 | FLL | Ft. Lauderdale, FL | |
| 19 | AUS | Austin, TX | 19 | ABQ | Albuquerque, NM | |
| 20 | SEA | Seattle, WA | 20 | SAT | San Antonio, TX | |
| 21 | SAT | San Antonio, TX | 21 | MKE | Milwaukee, WI | |
| 22 | PBI | Palm Beach, FL | 22 | SLC | Salt Lake City, UT | |
| 23 | ATL | Atlanta, GA | 23 | MSY | New Orleans, LA | |
| 24 | OGG | Kahului, HI | 24 | CMH | Columbus, OH | |
| 25 | RSW | Fort Myers, FL | 25 | SMF | Sacramento, CA | |
Arrival airports
In fact, when the TripIt team looked comparatively at multiple cities with two or more airports, we found that the smaller airports were rated significantly higher than the major hub. New York was the only exception, with JFK nabbing the top spot. Abbamonte shared, “With the ever-ongoing construction at LaGuardia, it can take longer to get to and from Manhattan than if you traveled further to JFK or EWR. LGA is also notorious for flight delays and cancellations.” Price could also be a factor. Hipmunk analyzed domestic flights to metropolitan areas served by multiple airports from September 2017 to August 2018 and found that arriving at an alternate airport can save travelers an average of 25 percent on the booking price. However, it’s not the determining factor: of the eight metro areas analyzed, half of the airports that claimed the top spot also boasted the lowest median price—indicating that travelers are willing to pay more to have an enjoyable flight experience.| Rank | Region | Airport Code | Median Booking Price |
| 1 | New York | JFK | $305 |
| 2 | New York | LGA | $243 |
| 3 | New York | EWR | $283 |
| 1 | Miami | FLL | $237 |
| 2 | Miami | MIA | $298 |
| 1 | Los Angeles | BUR | $234 |
| 2 | Los Angeles | LAX | $267 |
| 1 | Houston | HOU | $333 |
| 2 | Houston | IAH | $271 |
| 1 | Dallas | DAL | $262 |
| 2 | Dallas | DFW | $258 |
| 1 | DC | BWI | $231 |
| 2 | DC | DCA | $290 |
| 3 | DC | IAD | $313 |
| 1 | Chicago | MDW | $337 |
| 2 | Chicago | ORD | $250 |
| 1 | Bay Area | OAK | $206 |
| 2 | Bay Area | SJC | $264 |
| 3 | Bay Area | SFO | $294 |
Travelers in Southern Cities Rated Their Flights Highest
Travelers living in Honolulu, HI topped the charts again this year as the happiest fliers in the nation. The happiest hometowns of 2018 remained largely the same as last year, with those cities below the Mason–Dixon line like Tampa, New Orleans, Fort Lauderdale, and Atlanta holding strong and capturing several of the top 25 slots.
| Happiest Hometown | |
| Rank | City |
| 1 | Honolulu, HI |
| 2 | Baltimore, MD |
| 3 | Nashville, TN |
| 4 | Albuquerque, NM |
| 5 | Omaha, NE |
| 6 | Tampa, FL |
| 7 | Columbus, OH |
| 8 | Milwaukee, WI |
| 9 | New Orleans, LA |
| 10 | San Diego, CA |
| 11 | Scottsdale, AZ |
| 12 | Oklahoma City, OK |
| 13 | Las Vegas, NV |
| 14 | San Diego, CA |
| 15 | San Antonio, TX |
| 16 | Oakland, CA |
| 17 | Kansas City, MO |
| 18 | Bellevue, CA |
| 19 | Fort Lauderdale, FL |
| 20 | Pittsburgh, PA |
| 21 | Jacksonville, FL |
| 22 | Atlanta, GA |
| 23 | Salt Lake City, UT |
| 24 | Austin, TX |
| 25 | Louisville, KY |
Fall was the Happiest Travel Season
Travelers rated their flights the highest in the fall, with summer being the least happy season to travel. Flights received the highest rating in September, after one of the busiest summer travel seasons to date. Travel expert Johnny Jet advised, “Fall is a great time to travel. Since it’s technically the off-season, hotels and airfare prices are lower than the summer and holiday seasons. With kids back in school it also tends to be a lot less crowded. The weather is typically mild and it’s a picturesque season with the changing leaves.”| Happiest Travel Season | |
| Rank | Month |
| 1 | September |
| 2 | November |
| 3 | October |
| 4 | January |
| 5 | April |
Millennials are the Happiest Fliers
International Travelers were Happiest Flying to Coastal Cities
International travelers favored airports in coastal cities, with Los Angeles, San Francisco and New York topping the list.
All of the top ranked airports for international travelers offer Automated Passport Control (APC), which is a U.S. Customs and Border Protection (CBP) program that expedites the entry process for U.S., Canadian and eligible Visa Waiver Program international travelers. Instead of filling out a paper Customs declaration form, eligible passengers proceed directly to the APC kiosks in the passport control area. Travelers are prompted to scan their passport, take a photograph using the kiosk, and answer a series of CBP inspection related questions verifying biographic and flight information.
| Happiest US Airports | |
| Rank | Airport |
| 1 | LAX |
| 2 | JFK |
| 3 | SFO |
| 4 | MIA |
| 5 | EWR |
Asian Countries were among the Highest Rated Destinations for US Travelers
For US travelers, we found that Japan, Hong Kong and Mexico were popular destinations throughout the year. According to an article by the Economist, tourism in Asia and the Pacific is growing faster than anywhere else in the world.
| Happiest Destinations | |
| Rank | Country |
| 1 | Japan |
| 2 | Hong Kong |
| 3 | Mexico |
| 4 | Germany |
| 5 | United Kingdom |
